
UX Design
Covid-19 Analytics Dashboard Application
Case study on designing a dashboard with complex data points.
Main Goal
Present user with detailed analytics on on Covid-19
My Role
Product, UX, UI and Visual Designer and Researcher
Time Frame
3 months
The Problem
The goal of the project was to create a detailed analytical and visually stunning Covid-19 informational dashboard.
So, first of all … what’s the problem?
Most of the current data for Covid-19 rates is difficult to read
as Engineers are not designers and most of the data is being compiled by Engineers and not designed by UI and UX Designers.
- What are the main goals and habits when viewing Covid-19 data?
- What pain point are users hitting while viewing Covid-19 data?
- Are there any issues that slow down dashboard navigation?
- Over complicated process for finding specific Covid-19 data.
- Can users find the data they need quickly?
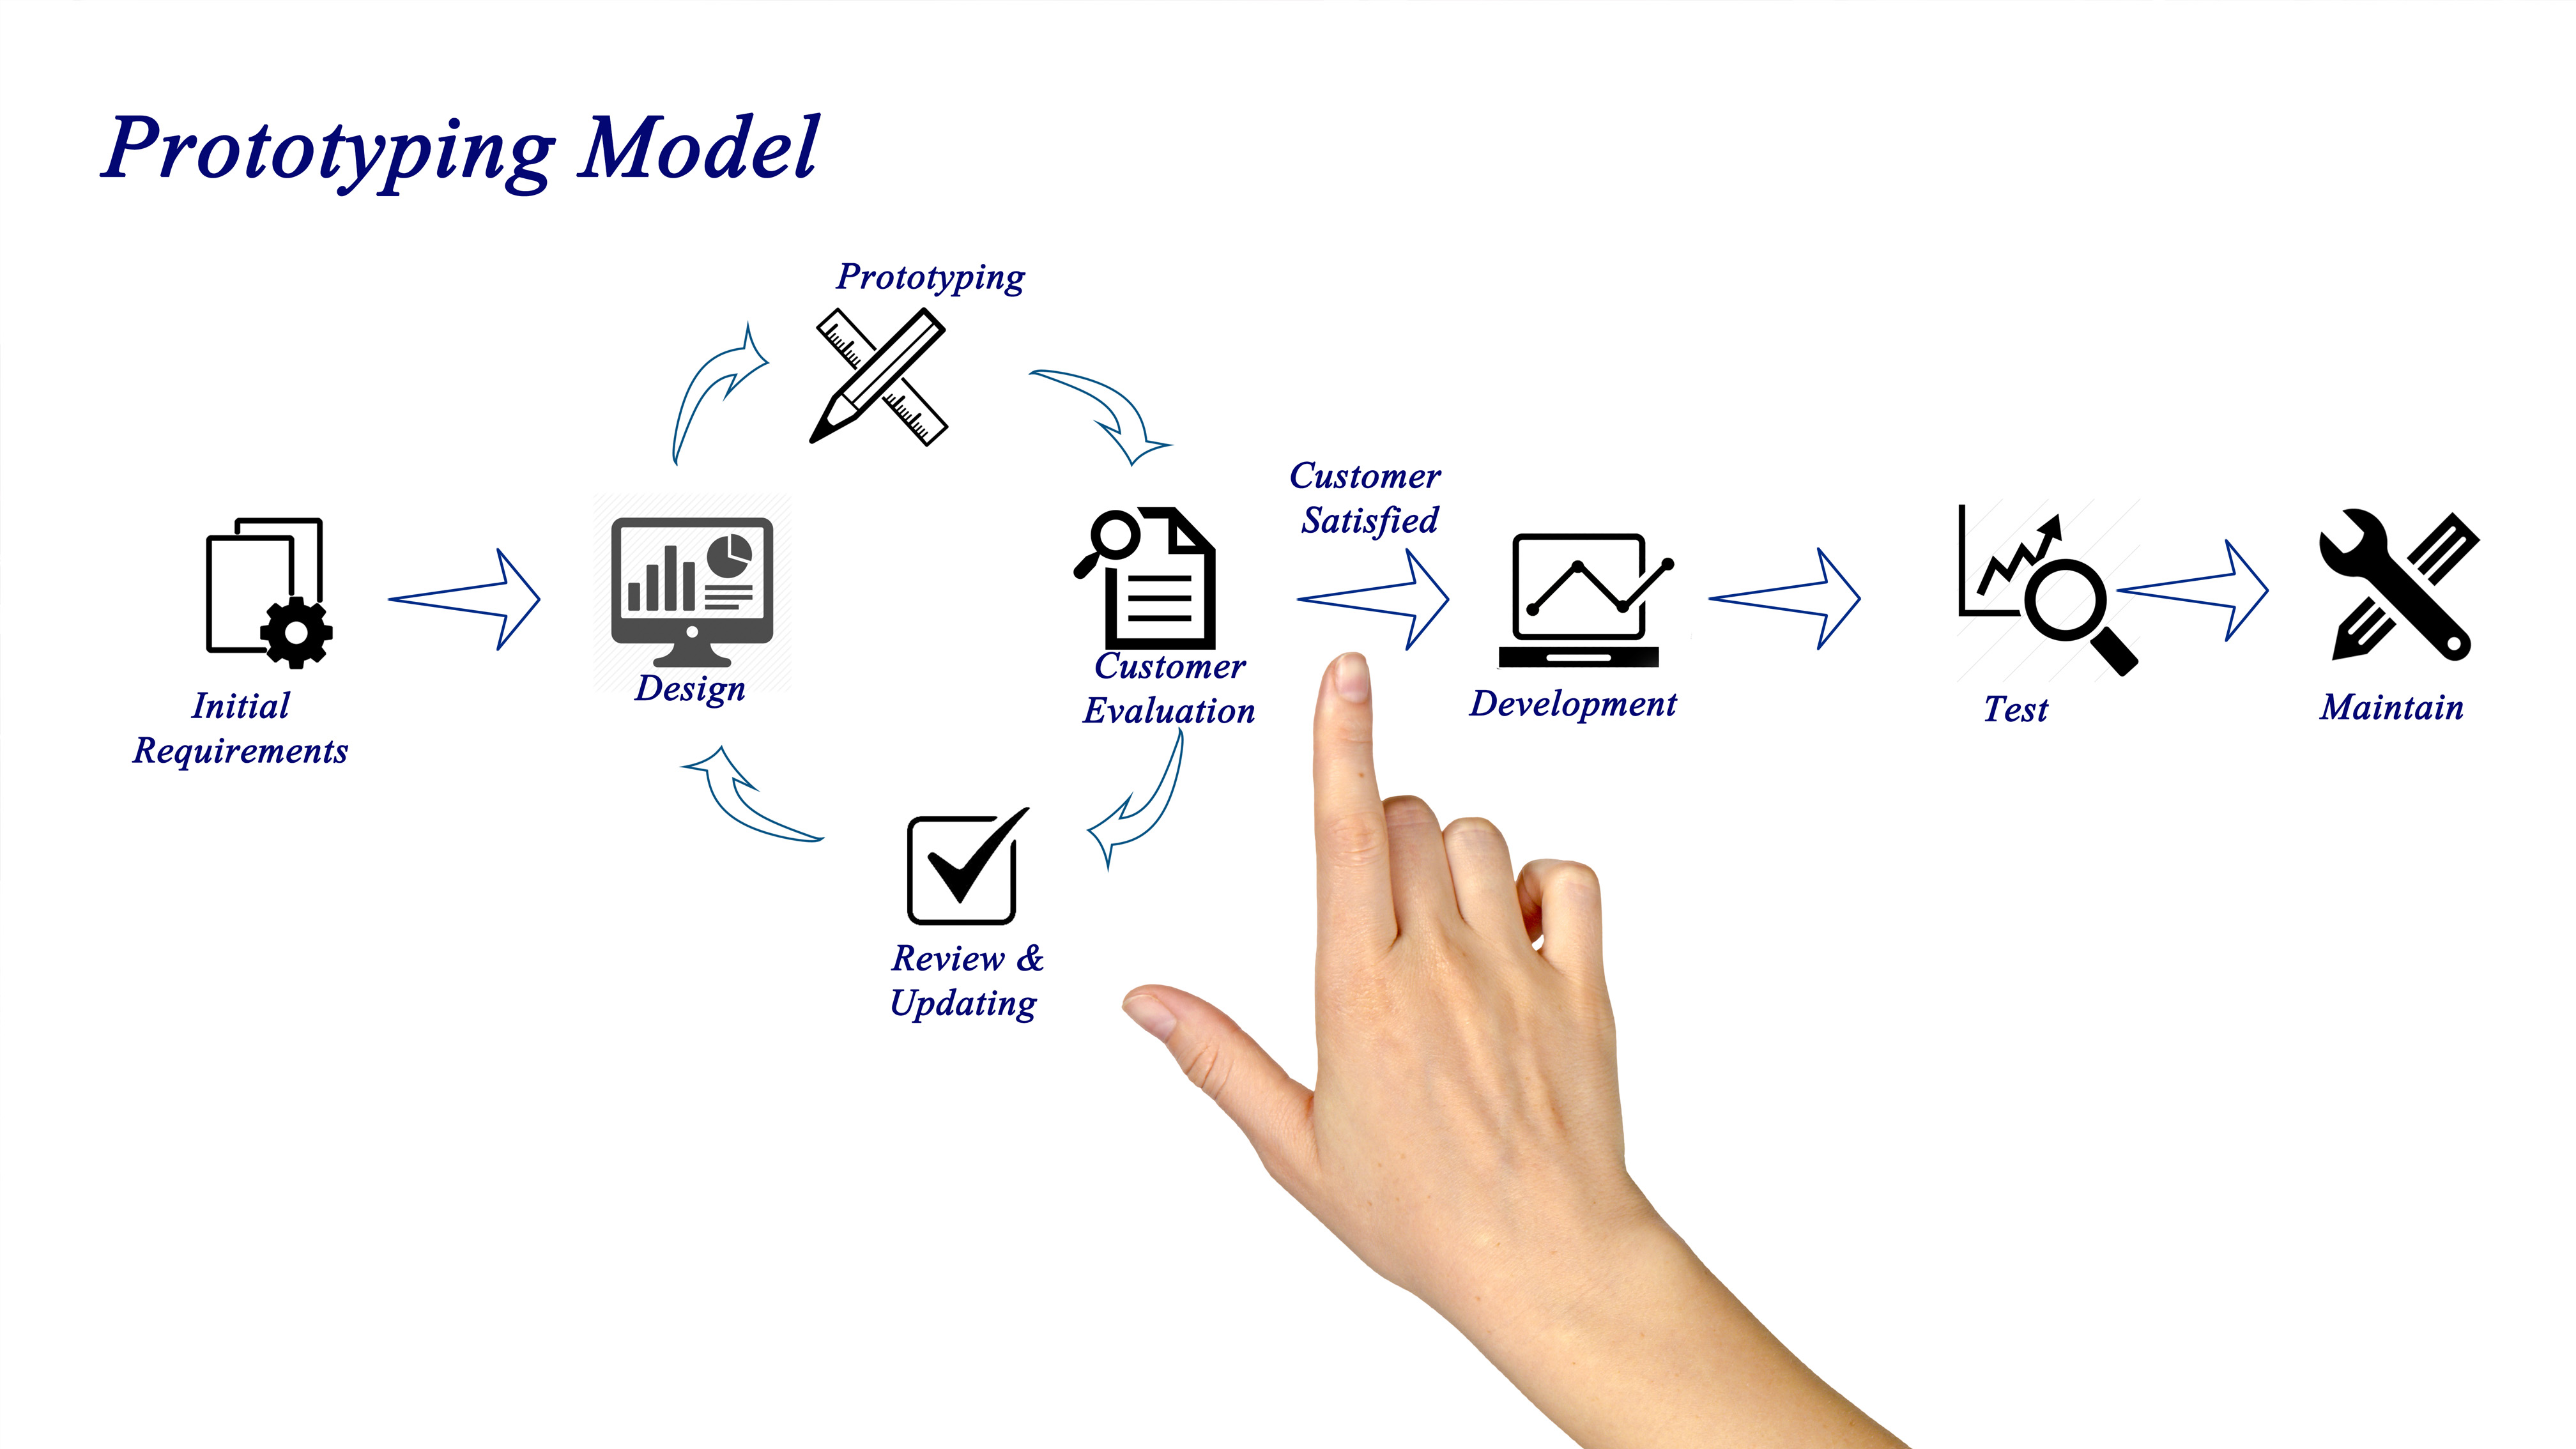
My UX Process
I follow IDEO's Human-Centered Design and the
Lean UX Design Thinking process.
I use the the below research methods as I feel this process is the best way to accumulate quantitative & qualitative data on users and competitors in most industries. This in turn informs my design with a research & evidence based solution.
-
1
Research
Usability Tests
Depth Interviews
Online Surveys
Competitive Benchmarking Analysis -
2
Analysis
Affinity Diagram
Customer Journey Map
Personas -
3
Design
Flow Diagram
Defining Navigation
Sketching
Wireframing -
4
Prototype
Low, Medium and High Fidelity Prototypes
Interactive Prototype
Finalize Design and Strategy -
5
Test
Usability Tests
Depth Interviews on Prototype
Iteration

Covid-19 Dashboard
Final Design
Interactive Prototype
The goal of the project was to create a detailed analytical and visually stunning Covid-19 informational dashboard.
So, first of all … what’s the problem?
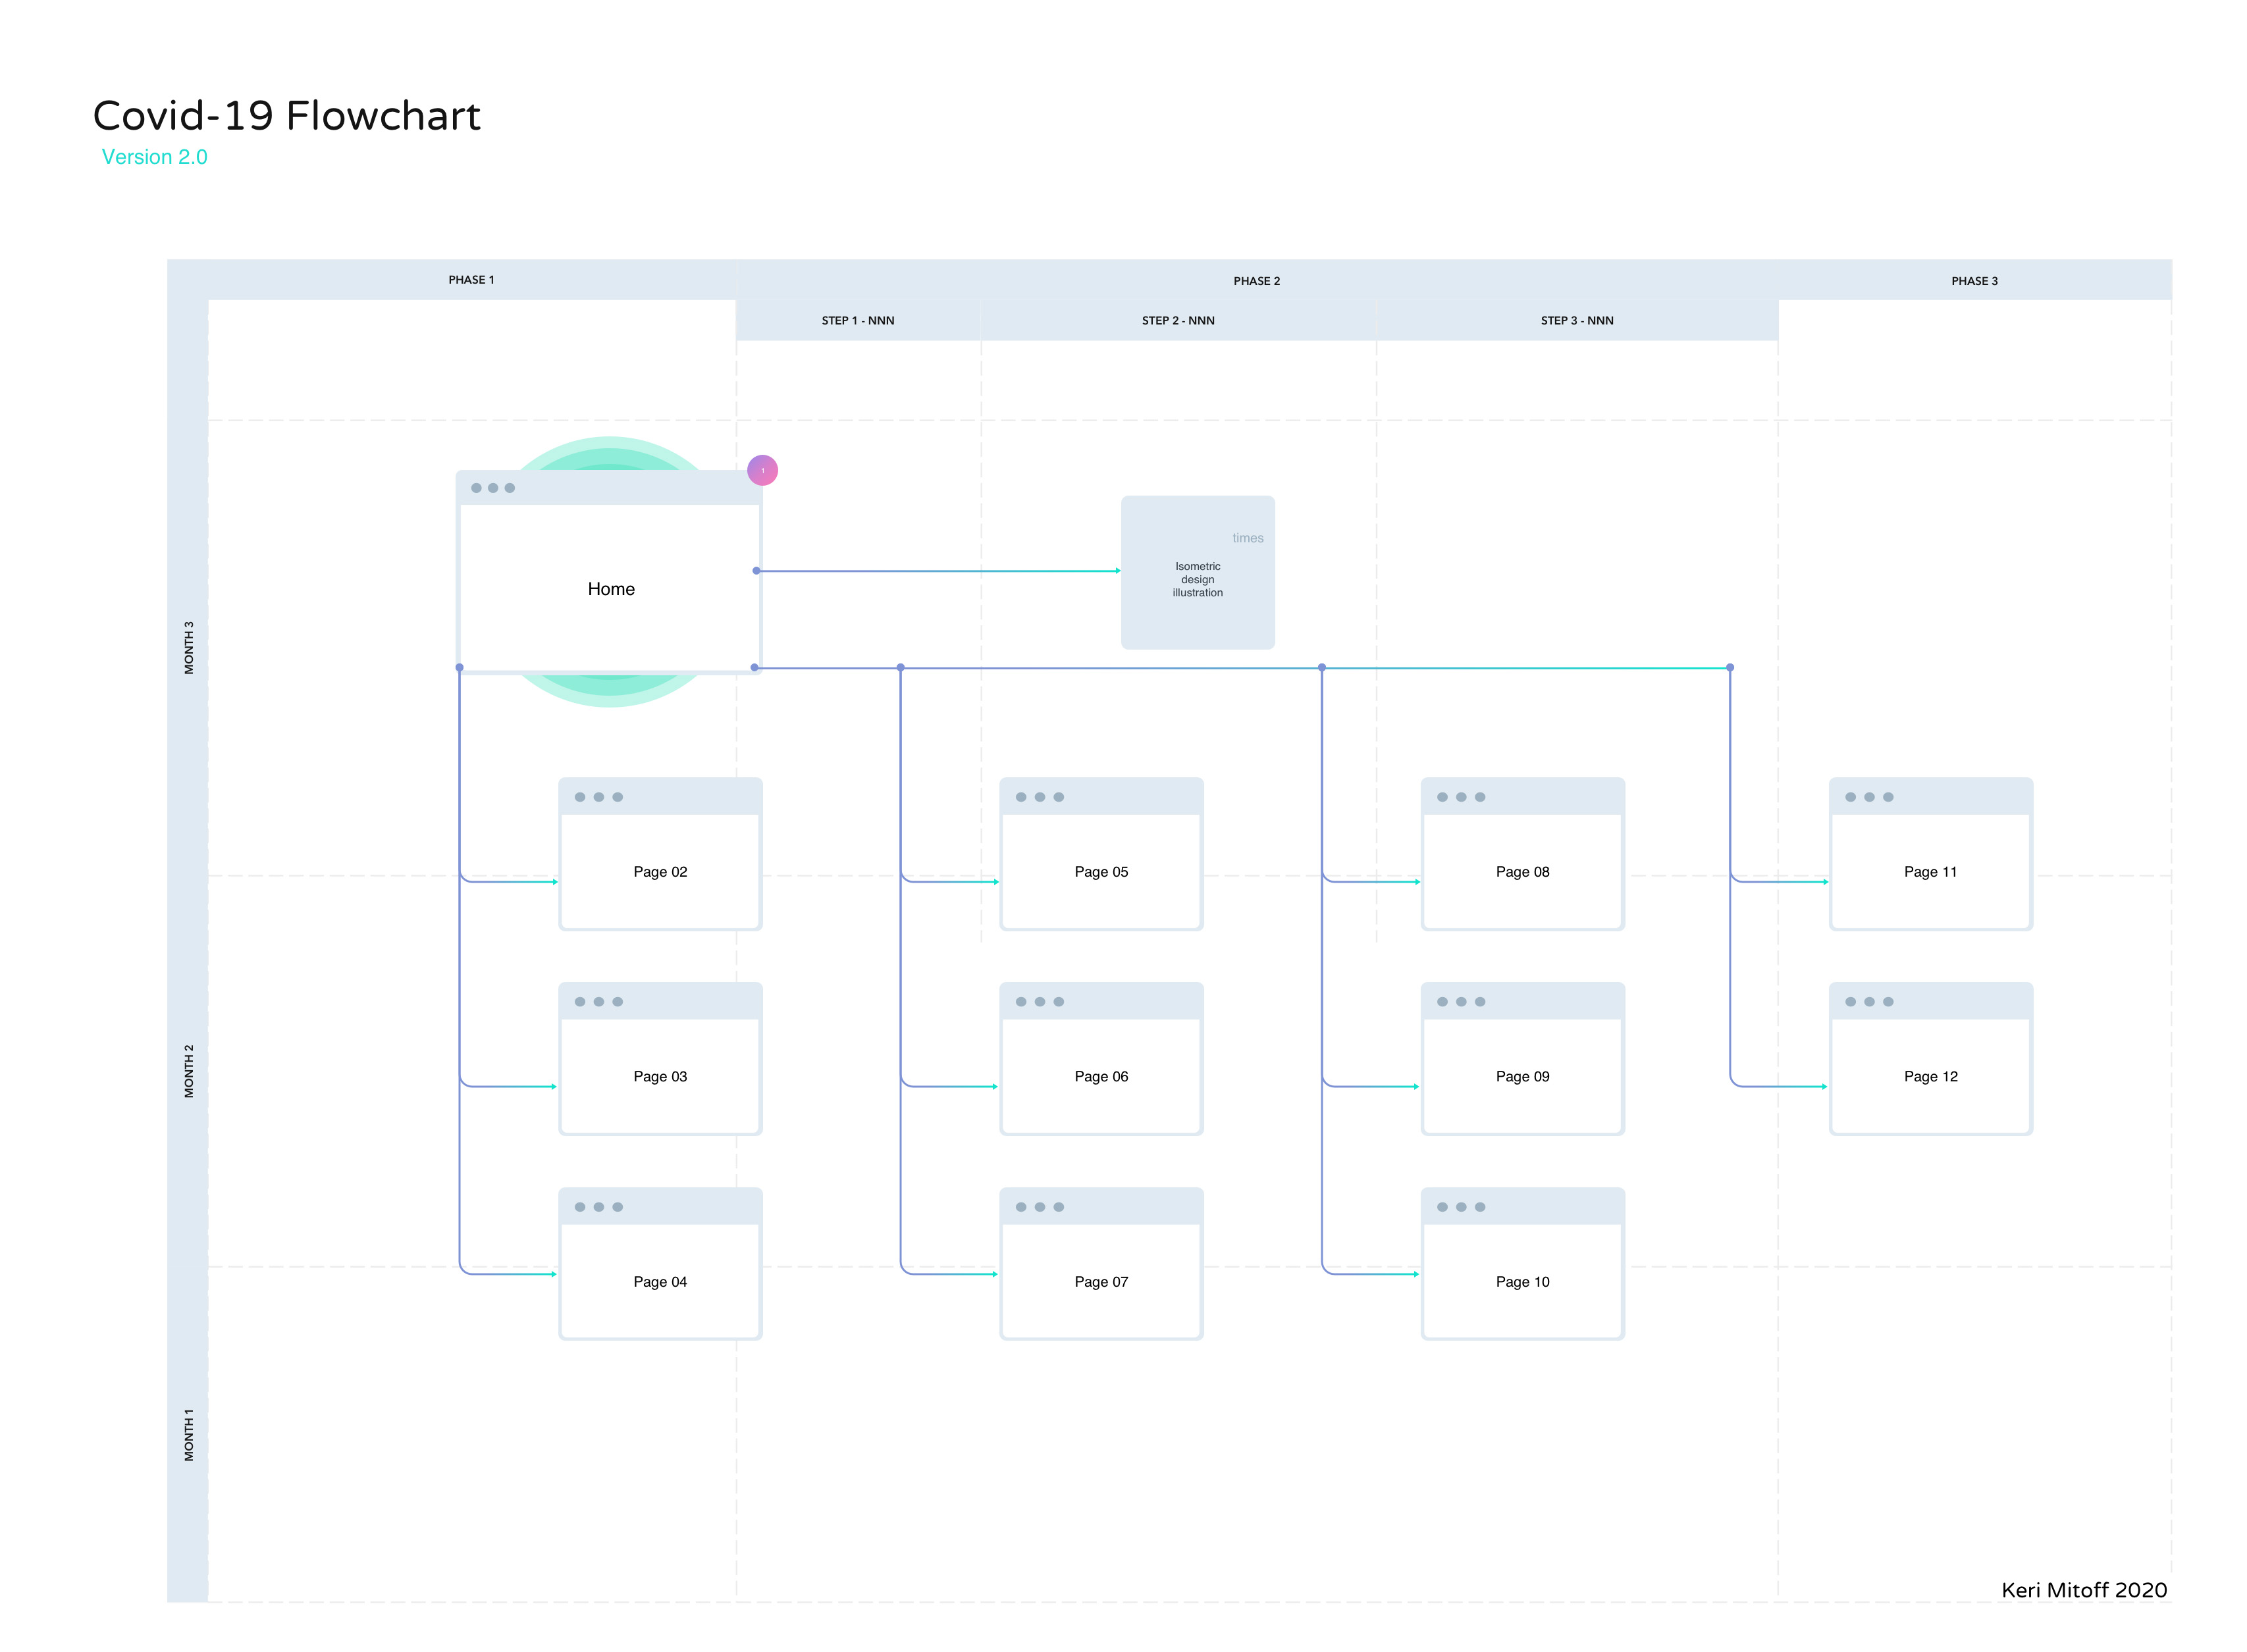
I used wireframes and a flowchart to validate my low-fi designs. While I enjoy this process, it can be difficult to know how much detail to go into and when to stop. I wanted my prototype to be exactly that, a prototype - it’s function is to test and validate, it does not need to do everything right now. I stopped at a point where I believed I had solved the problems found during research/analysis and where I was relatively happy with the layout/design.
View Interactive Animated Prototype ↗